China's export value and volume of PMIDA keep reducing. Thereinto,
the YoY fall of export value is much larger than that of export volume.
Source: Baidu
In recent years, exports of PMIDA keep decreasing in China. And
the YoY fall of export value far outstrips that of export volume. According to
the China Customs, the export value of PMIDA reduced year by year since 2013.
Of this, in 2014 and 2015, the YoY falls were 20.76% and 29.03% in export value
and were 5.65% and 4.56% in export volume respectively.
Although the export volume has a YoY rise of 12.45% in Jan.-Feb.
2016, the export value still suffered YoY fall of 11.62%.
There are two reasons for the depressed exports of PMIDA.
Firstly, the cancelation of the export tax rebate reduces PMIDA's
export competitiveness to some extent. Since 1 May, 2015, China officially canceled
the export tax rebate policy on PMIDA, from 13% to 0%.
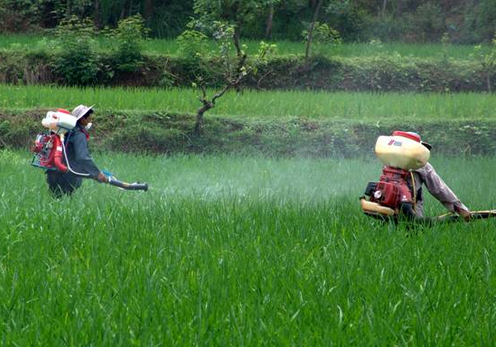
Secondly, the glyphosate market remained sluggish, pushing down
the price of PMIDA (major raw material for glyphosate). Glyphosate price keeps
decreasing in recent years, dropping to the historical low at present. And it
is not likely to rebound in a short run. Therefore, the PMIDA price falls as
well. But since the export price of PMIDA greatly reduces, foreign purchasers
are more willing to import China’s PMIDA to produce glyphosate for sale. This
slows the decline of export volume of PMIDA.
Exports of PMIDA in China,
2013-Jan.-Feb. 2016
|
Time
|
Export
volume, tonne
|
YoY
change
|
Export
value, million USD
|
YoY
change
|
|
2013
|
64,523
|
N/A
|
189.51
|
N/A
|
|
2014
|
60,878
|
-5.65%
|
150.18
|
-20.76%
|
|
2015
|
58,101
|
-4.56%
|
106.58
|
-29.03%
|
|
Jan.-Feb. 2016
|
10,425
|
12.45%
|
16.81
|
-11.62%
|
Source:
China Customs and CCM
Monthly exports of PMIDA in
China, Jan. 2015-Feb. 2016
|
Year
|
Month
|
Export volume, tonne
|
YoY change
|
Export value, million USD
|
YoY change
|
|
2015
|
Jan.
|
3,032
|
-57.67%
|
6.40
|
-66.13%
|
|
Feb.
|
6,239
|
18.43%
|
12.62
|
-8.45%
|
|
March
|
3,548
|
-47.78%
|
6.86
|
-61.98%
|
|
April
|
6,632
|
43.48%
|
12.58
|
1.51%
|
|
May
|
9,073
|
362.51%
|
17.11
|
229.73%
|
|
June
|
5,209
|
-10.36%
|
9.90
|
-31.31%
|
|
July
|
3,100
|
-43.79%
|
5.69
|
-57.71%
|
|
Aug.
|
3,953
|
-2.29%
|
7.06
|
-24.30%
|
|
Sept.
|
3,956
|
48.88%
|
6.60
|
9.64%
|
|
Oct.
|
3,578
|
-12.83%
|
5.87
|
-37.85%
|
|
Nov.
|
3,236
|
-42.47%
|
5.33
|
-58.55%
|
|
Dec.
|
6,545
|
-10.46%
|
10.56
|
-35.41%
|
|
2016
|
Jan.
|
6,466
|
113.23%
|
10.52
|
64.36%
|
|
Feb.
|
3,960
|
-36.53%
|
6.29
|
-50.16%
|
Source:
China Customs and CCM
Export destination
China's PMIDA is mainly exported to the US, Argentina and India.
Data from China Customs show that the US and Argentina imported 58,076.25
tonnes of PMIDA from China in year 2015, which valued at USD106.54 million,
99.96% and 99.97% of China's total. The US was the first largest export
destination with import volume of 23,452.80 tonnes in 2015, 40.37% of the
total.
Exporter
Sichuan, Hubei and Shandong provinces are major producing areas of
PMIDA in China, with 47,221.75 tonnes of export volume and USD86.82 million of
export value in 2015, 81.27% and 81.47% of the total respectively. Thereinto,
Sichuan ranked first, with 20,389.20 tonnes of export volume and USD37.65
million of export value, 35.09% and 35.33% separately.
China mainly exported PMIDA via Nanjin Port, Wuhan Port and
Qingdao Port. In 2015, 44,872 tonnes of PMIDA was exported via these three
ports, which valued at USD83.50 million, 77.23% and 78.34% of the total.
Export destinations of PMIDA in
China, 2015
|
No.
|
Export destination
|
Volume, tonne
|
Value, thousand USD
|
|
1
|
The
US
|
23,452.80
|
41,836.37
|
|
2
|
Argentina
|
22,040.40
|
41,615.94
|
|
3
|
India
|
12,583.05
|
23,088.44
|
|
4
|
Turkey
|
18.00
|
34.20
|
|
5
|
Hong
Kong
|
6.00
|
12.58
|
|
6
|
Brazil
|
0.60
|
1.68
|
|
7
|
Israel
|
0.50
|
1.34
|
Source:
China Customs and CCM
Exports of PMIDA by origin in
China, 2015
|
No.
|
Origin
|
Volume, tonne
|
Value, thousand USD
|
|
1
|
Sichuan
Province
|
20,389.20
|
37,648.41
|
|
2
|
Hubei
Province
|
17,750.10
|
32,036.01
|
|
3
|
Shandong
Province
|
9,082.45
|
17,139.77
|
|
4
|
Beijing
|
3,582.00
|
6,905.05
|
|
5
|
Jiangsu
Province
|
2,712.00
|
4,452.39
|
|
6
|
Chongqing
|
2,138.40
|
3,914.82
|
|
7
|
Anhui
Province
|
1,945.20
|
3,480.15
|
|
8
|
Hebei
Province
|
156.00
|
310.37
|
|
9
|
Guandong
Province
|
131.00
|
244.61
|
|
10
|
Shanghai
|
117.00
|
222.44
|
|
11
|
Henan
Province
|
80.00
|
200.00
|
|
12
|
Guangxi
Zhuang Autonomous Region
|
18.00
|
36.54
|
Source:
China Customs and CCM
Exports of PMIDA by port in
China, 2015
|
No.
|
Port
|
Volume, tonne
|
Value, thousand USD
|
|
1
|
Nanjing
Port
|
16,353.60
|
30,935.46
|
|
2
|
Wuhan
Port
|
16,691.20
|
30,086.97
|
|
3
|
Qingdao
Port
|
11,827.60
|
22,473.60
|
|
4
|
Shanghai
Port
|
9,117.75
|
15,729.04
|
|
5
|
Chengdu
Port
|
2,718.00
|
4,899.43
|
|
6
|
Hefei
Port
|
1,105.20
|
1,935.26
|
|
7
|
Chongqing
Port
|
270.00
|
494.25
|
|
8
|
Nanning
Port
|
18.00
|
36.54
|
Source:
China Customs and CCM
This article comes from Glyphosate China Monthly Report 1604, CCM

About CCM:
CCM is the
leading market intelligence provider for China’s agriculture, chemicals, food
& ingredients and life science markets. Founded in 2001, CCM offers a range
of data and content solutions, from price and trade data to industry
newsletters and customized market research reports. Our clients include
Monsanto, DuPont, Shell, Bayer, and Syngenta. CCM is a brand of Kcomber Inc.
For more information about CCM, please visit www.cnchemicals.com or get in touch with us directly by emailing econtact@cnchemicals.com or calling +86-20-37616606.
Tag: PMIDA glyphosate